It can be a challenge to identify poor performing Google Ads. R can help by using statistics to find ads that should be replaced.
If you manage Google Ads accounts, you have likely added ads to ad groups and checked their performance over time. It is generally a good idea to have two or three ads in an ad group, running at the same time. Then you can compare them, pause the ads that are not performing well, then introduce new ads.
However, you may have noticed that ads are not always shown equally during a given period. Even if they are, there is often not enough data to determine that one ad is actually better than another. That makes it more difficult to identify poor performing Google Ads.
Another issue is that you likely have a number of campaigns, with a number of ad groups. That leaves you with a lot of ads to review and determine which ones should be paused (so you can introduce new ads). A corollary to this function is what type of new ads should be introduced – that’ll be for another post.
At the heart of successfully managing media is analytics. In other words, your media success is in proportion to how deeply you utilize your data to make decisions. To that end, in this post I’m going to show you how to create an R Shiny app to run through your ads and display a list of ads that should be paused based on a statistical analysis.
Accessing Google Ads Through R
The first step is to get access to data through Google Ads api. To do this you must set up an MCC (My Client Center) account. This is a must if you are an agency handling multiple accounts (you should know that if you are) as well as those that are only handling a single account internally (we’ll call that account the client account). Once you have set up the MCC account, connect to the client by sending a request for access using the account id.
Once that is all taken care of, you will need to set up api access. To do that, go to the MCC account, Tools & Settings, API Center and fill out the form for api access. You will need Basic Access, so fill out the Basic Access form. Then, wait…
It generally takes a few days for you to receive a confirmation for your Basic Access api request to be cleared. Once it does, we’re ready to build our Shiny app.
Shiny App Set-up
I’m going to do this as a single file R Shiny app with a single (client) account, just to simplify the process. Because of that, I’m going to hard-code the account id as a variable. If you have multiple accounts, you can use a drop-down to make a selection or retrieve all accounts and output the list with the account.
To start, here is our global variables:
# Set the locale, otherwise, an error can be thrown.
Sys.setlocale('LC_ALL','C')


# Use pacman to load libraries to make it easier to download
# if not installed.
if (!require("pacman")) install.packages("pacman")
pacman::p_load(shiny,
               tidyverse,
               shinythemes,
               config,
               pwr,
               RAdwords,
               DT,
               scales)

# Authenicate access - this will open a browser window
# for you to authenicate. Without the Basic Access token
# this will error later, when we try to retrive data.
google_ads_auth <- doAuth(save = T)
This will load al the packages we are going to be using, plus setting up authentication for Google Ads. Sys.setlocale() may not be something you need to use, but it has solved issues for me, so I always include it.
Creating the UI
Next, you will need a UI to interface with. To do that we set the ui to fluidPage(), which we’ll call at the end, to run the Shiny app. I set the theme to “lumen” because I like that theme. There are many others. We then add our rows and columns.
ui <- fluidPage(theme = shinytheme("lumen"),

                titlePanel("Google Ads: Under Performing Ads"),

                fluidRow(

                        column(3,
                               dateInput("begin_date_select",
                                         "Ad Begin Date:",
                                         min = Sys.Date() - 180,
                                         max = Sys.Date(),
                                         value = Sys.Date()-90),

                               dateInput("end_date_select",
                                         "Ad End Date:",
                                         min = Sys.Date() - 180,
                                         max = Sys.Date(),
                                         value = Sys.Date()),

                               selectInput('conv_category', 'Evaluate by CTR or Conv. Rate (select one):',
                                           c("Pick one" = "",
                                             "CTR" = "ctr",
                                             "Conversion Rate" = "conv_rate")),

                               actionButton("goButton", "Calculate")
                        ),

                        column(9,


                               # A list of the poor performing ads.
                               div(DT::dataTableOutput("ads_table", width = "100%", height = "auto"),
                                   style = "font-size:80%")

                        )

                )

)
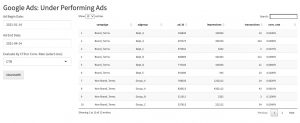
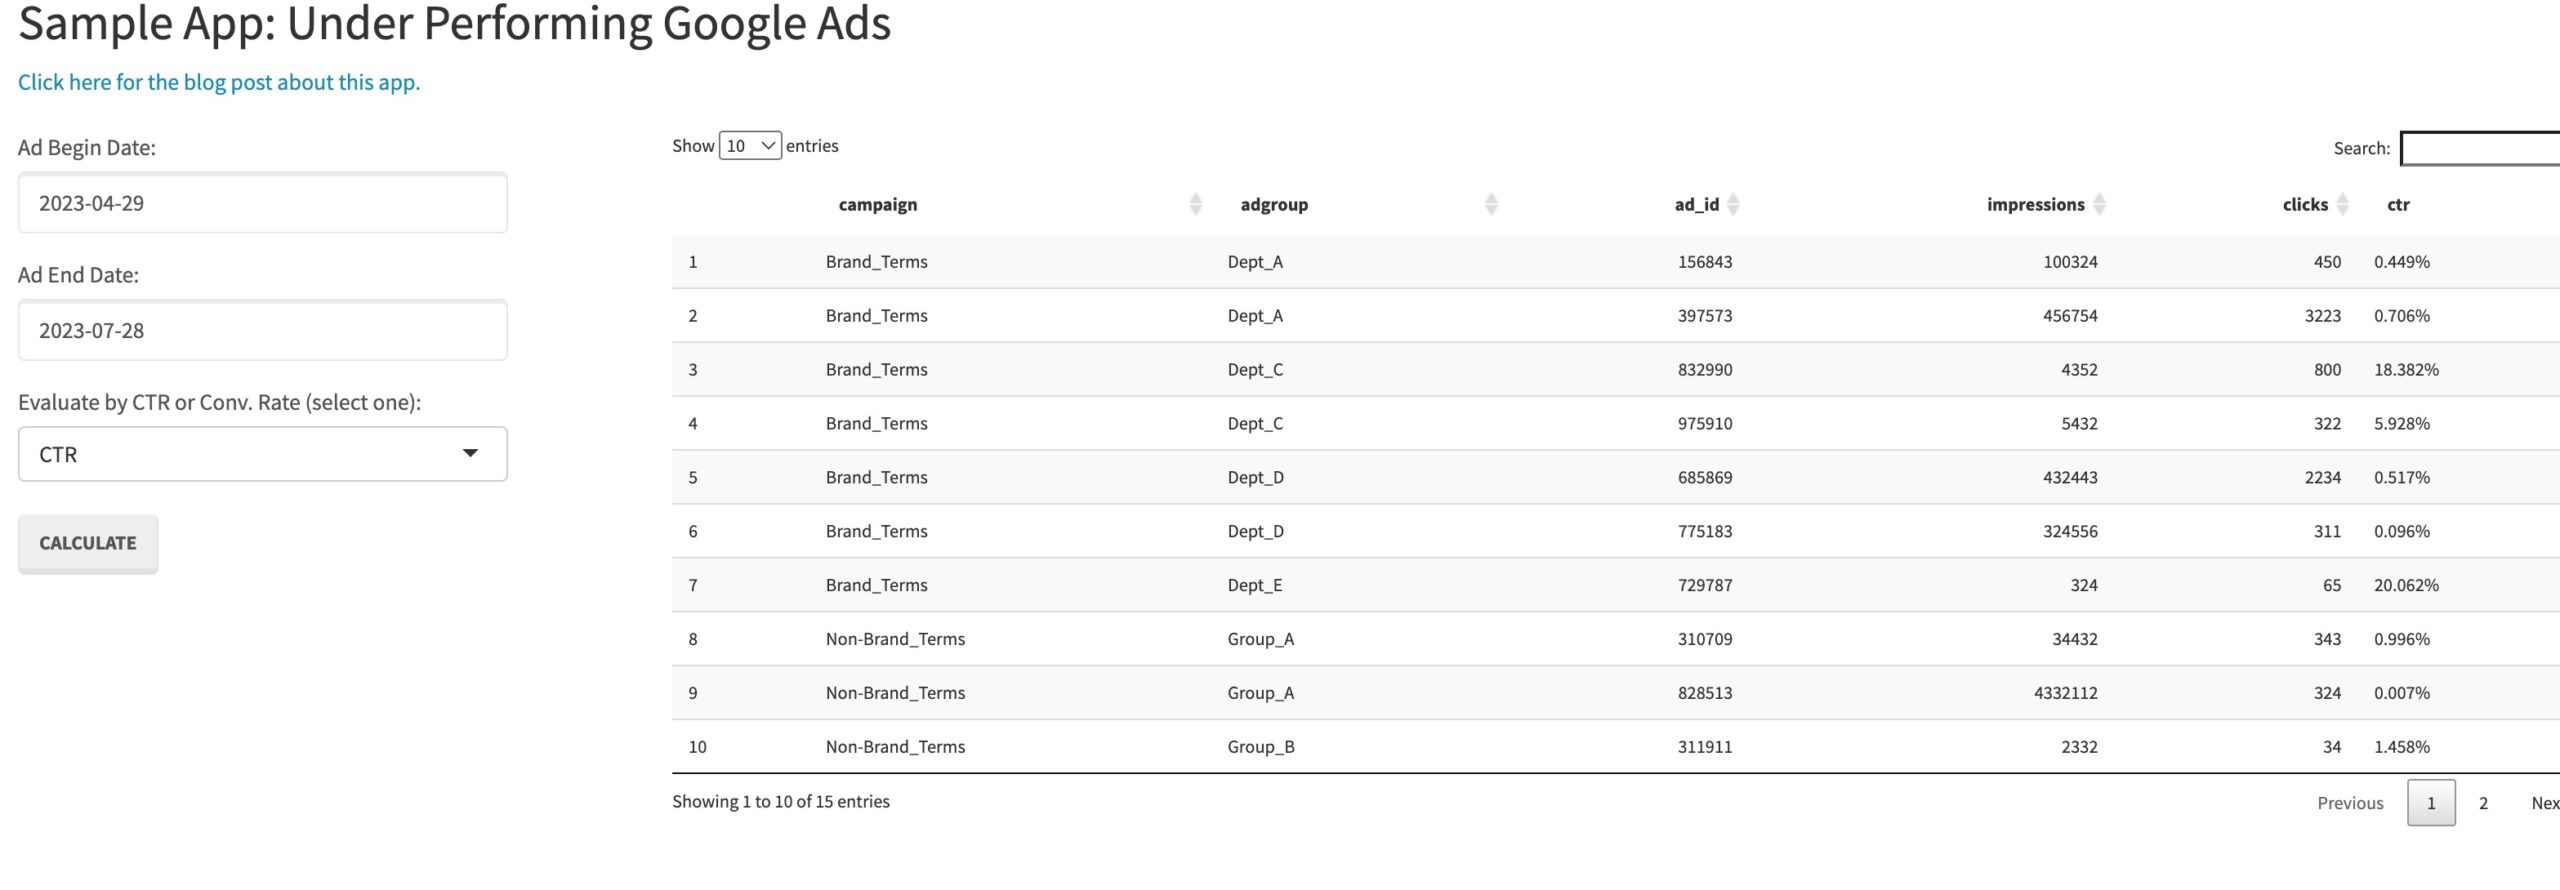
As you can see, there is just one row – a fluidRow(). That is because this is a rather simple UI. The columns can range from 1 to 12. So we are using 3 column spaces for the inputs and 9 column spaces for the table output. There is also a title. In this case, I’m using “Google Ads: Under Performing Ads”.
The inputs are the date range you want to use to calculate performance. Keep in mind that the way I have programmed this, it will only evaluate the ads that are currently running. The reason for this is that you don’t want to pause those ads, only to see them again and again in the output. So, I would recommend a recent date range to review.
Choosing Conversions
In the UI, you can also choose to calculate performance based on CTR or Conversion Rate. Either of these KPIs would be from Google Ads. You may be using Google Analytics to capture transactions, but those will not show up in Google Ads unless you have configured your conversions to include GA transactions.
Generally, I would recommend that approach, but you may be using a Google Ads pixel. Just check that your conversions are correct, or none of this will matter. CTR is a lot more straight forward, but has less to do with final results. You can also set up other conversions in GA or through a Google Ads pixel and use that in your Google Ads conversions.
There is also an actionButton. Without this, every time you updated one field, but before you were done, the app would run and try to retrieve the data. The actionButton allows you to update the dates and CTR/Conversion Rate options, then fetch the data.
Finally, there is the output – DT::dataTableOutput() – which outputs a table with the underperforming ads.
Creating the Server
The server function is going to be inside a function called shinyServer(function(input, output){}). I’m going to go through this one piece at a time. At the end of this post I’ll have a link to the Shiny file in full.
To start, I’m going to use a function called ad_data(), in which I’ll pass the begin/end date, the Google Ads account id and whether to calcuate performance based on CTR or Conversion Rate. I’ve added a lot of comments in the code (I’m not usually this verbose in code comments – but this is a way to understand the code), so read through those to understand what is executing and why.
server <- shinyServer(function(input, output) {
# This fuction will do all the work on the ads
# and return the data to the calling function.
ad_data <- function(begin_date,
end_date,
account_id,
conv_category) {
# We're going to use the AD_PERFORMANCE_REPORT
# to retrieve the data from Google Ads.
# We want to make sure we're getting the raw data -
# CTR and Coversion Rate would be useless here since
# we need the raw numbers to feed into our model.
body <- statement(select = c('CampaignName',
'CampaignStatus',
'AdGroupName',
'AdGroupStatus',
'Id',
'Status',
'Impressions',
'Clicks',
'Conversions'),
report = "AD_PERFORMANCE_REPORT",
start = begin_date,
end = end_date)
# Query Adwords API and load data as dataframe.
# Use Adwords Account Id (MCC Id will not work).
# If you do not have Basic Access API, this will error.
get_data <- getData(clientCustomerId = account_id,
google_auth = google_ads_auth,
statement = body)
# Now that we have the raw data, we're going to do a few things to it:
# 1. rename some of the columns to something more R like.
# 2. filter for those ads that have over 100 impressions (larger sample size),
#    remove adgroup and ad_id that equal '(not set)',
#    finally, evaluate only ads that are enabled, in adgroups that are enabled
#    from campaigns that are enabled.
# 3. calcuate CTR, Conversion Rate, and add two new columns:
#    ctr_update and conv_rate_update.
# 4. Select only those columns needed going forward.
#    For example, we no longer need Campaignstate.
ads_data <- get_data %>%
dplyr::rename(campaign = Campaign,
adgroup = Adgroup,
ad_id = AdID,
clicks = Clicks,
impressions = Impressions,
transactions = Conversions) %>%
dplyr::filter(impressions > 100,
adgroup != '(not set)',
ad_id != '(not set)',
Campaignstate == 'enabled',
Adgroupstate == 'enabled',
Adstate == 'enabled') %>%
dplyr::mutate(ctr = round(clicks/impressions, 5),
conv_rate = round(transactions/impressions, 5),
ctr_update = FALSE,
conv_rate_update = FALSE) %>%
dplyr::select(campaign,
adgroup,
ad_id,
clicks,
impressions,
transactions,
ctr,
conv_rate,
ctr_update,
conv_rate_update)
# At the beginning we passed in conv_category to the fuction.
# conv_category can be one of two values: 'ctr' for CTR or
# conv_rate for Conversion Rate.
# Calculate output for one or the other.
if(conv_category == 'ctr'){
# It is important to aggrange the data by
# the campaign, adgroup, and ctr (click-through rate).
ads_data <- ads_data %>% arrange(campaign, adgroup, desc(ctr))
# We'll start with the first ad of the first adgroup.
# This will be the ad with the best CTR in the adgroup.
# We need to assign the ad group.
last_adgroup <- ads_data[1,'adgroup']
top_ad <- 1
# i will equal the next ad.
i <- 2
# We'll loop through all the ads.
while(i <= nrow(ads_data)){
# Check if this is a new adgroup - if so,
# this is the best performing ad in the set -
# because we sorted it that way -
# skip to the next ad, after assigning
# last_adgroup to the current adgroup and
# assigning top_ad to the current ad.
if(last_adgroup != ads_data[i,'adgroup']){
last_adgroup = ads_data[i,'adgroup']
top_ad <- i
i <- i + 1
next
}
# The following is the sample size (# of impressions) and
# the # of clicks from the top CTR ad in the ad group.
a_sample_size <- as.numeric(ads_data[top_ad,'impressions'])
a_comps <- as.numeric(ads_data[top_ad,'clicks'])
# The following is the sample size (# of impressions) and
# the # of clicks from the current ad in the ad group.
b_sample_size <- as.numeric(ads_data[i,'impressions'])
b_comps <- as.numeric(ads_data[i,'clicks'])
# We're going to use the prop.test() and use the current
# ad as the NULL or A in an A/B test. We're checking to
# see if the top ctr ad is statistically significantly
# greater than the A (current ad). If it is, we'll signal to change
# the current ad.
# We'll use a 0.13 as a p-value as the value for change.
# Why 0.13 - it's a prime and it seems resonable.
myProp <- prop.test(x = c (a_comps, b_comps),
n = c (a_sample_size, b_sample_size),
alternative = 'greater')
# Check to make sure you have a p-value.
if(is.nan(myProp$p.value)){
i <- i + 1
next
}
# If the p-value is less than 0.13,
# update ctr_update to TRUE.
if(myProp$p.value < 0.13) {
ads_data[i, 'ctr_update'] <- TRUE
}
# Move to the next row.
i <- i + 1
}
# Output only the ads that have ctr_update == to TRUE.
output <- ads_data %>% dplyr::filter(ctr_update == TRUE) %>%
dplyr::select(campaign,
adgroup,
ad_id,
impressions,
clicks,
ctr) %>%
dplyr::mutate(ctr = percent(ctr)) %>%
dplyr::arrange(campaign,
adgroup,
ad_id)
} else {
# In the alternate - this is for conversion rate - so order by
# campaign, adgroup, and conv_rate.
ads_data <- ads_data %>% arrange(campaign, adgroup, desc(conv_rate))
# We'll start with the first ad of the first adgroup.
# This will be the ad with the best CTR in the adgroup.
# We need to assign the ad group.
last_adgroup <- ads_data[1,'adgroup']
top_ad <- 1
# i will equal the next ad.
i <- 2
# We'll loop through all the ads.
while(i <= nrow(ads_data)){
# Check if this is a new adgroup - if so,
# this is the best performing ad in the set -
# because we sorted it that way -
# skip to the next ad, after assigning
# last_adgroup to the current adgroup and
# assigning top_ad to the current ad.
if(last_adgroup != ads_data[i,'adgroup']){
last_adgroup = ads_data[i,'adgroup']
top_ad <- i
i <- i + 1
next
}
# The following is the sample size (# of impressions) and
# the # of transactions from the top converting ad in the ad group.
a_sample_size <- as.numeric(ads_data[top_ad,'impressions'])
a_comps <- as.numeric(ads_data[top_ad,'transactions'])
# The following is the sample size (# of impressions) and
# the # of transactions from the current ad in the ad group.
b_sample_size <- as.numeric(ads_data[i,'impressions'])
b_comps <- as.numeric(ads_data[i,'transactions'])
# We're going to use the prop.test() and use the current
# ad as the NULL or A in an A/B test. We're checking to
# see if the top converting ad is statistically significantly
# greater than the A (current ad). If it is, we'll signal to change
# the current ad.
# We'll use a 0.13 as a p-value as the value for change.
# Why 0.13 - it's a prime and it seems resonable.
myProp <- prop.test(x = c (a_comps, b_comps),
n = c (a_sample_size, b_sample_size),
alternative = 'greater')
# Check to make sure you have a p-value.
if(is.nan(myProp$p.value)){
i <- i + 1
next
}
# If the p-value is less than 0.13,
# update conv_rate_update to TRUE.
if(myProp$p.value < 0.13) {
ads_data[i, 'conv_rate_update'] <- TRUE
}
# Move to the next row.
i <- i + 1
}
# Output only the ads that have conv_rate_update == to TRUE.
output <- ads_data %>% dplyr::filter(conv_rate_update == TRUE) %>%
dplyr::select(campaign,
adgroup,
ad_id,
impressions,
transactions,
conv_rate) %>%
dplyr::mutate(conv_rate = percent(conv_rate)) %>%
dplyr::arrange(campaign,
adgroup,
ad_id)
}
# Return the dataset.
return(output)
}
Calling the ad_data() Function
To call the ad_data() function and retrieve the data, I’m going to use a reactive dataframe. A reactive dataframe has scope outside of a single calling function and can be shared for use in charts, tables, other functions without having to refetch the data. As you’ll see, this is a fairly simple call.
get_ad_data <- reactive({
# If the actionButton ("goButton")
# was not pressed, exit the function.
if(input$goButton == 0){return()}
# Isolate and assign the inputs.
begin_date <- isolate(input$begin_date_select)
end_date <- isolate(input$end_date_select)
conv_category <- isolate(input$conv_category)
# This is your Google Ads Account ID.
# You can hard-code it here, or use a
# dropdown in the UI, as well as passing multiple
# which you can loop through by calling the
# ad_data() function and combining the dataframes
# with rbind().
account_id <- "XXX-XXX-XXXX"
# Validate the dates and conv_category.
validate_text <- paste('Woops! Your begin date is ', begin_date,
' and your end date is ', end_date,
'. I think you see the issue ;-)
Just adjust the dates and re-run. :-)',
sep = '')
validate(
need(begin_date < end_date, validate_text)
)
validate(
need(conv_category != '', "Opps! Select an Evaluation Category :-)")
)
# Call the ad_data function.
ad_data <- ad_data(begin_date,
end_date,
account_id,
conv_category)
# Return ad_data dataframe to the caller.
return(ad_data)
})
Creating the Data Table
The last thing that we need to do is to create the data table that will identify poor performing Google Ads that should be paused. The cool thing about this app is that when you pause the ads, they will not be considered again, next time you fetch the data.
You’ll see that there is not a lot to do here, since most of the work has been done already.
      # ads_table will match our table in the UI -
# we use renderDataTable({}) from the DT package
# to create the table and send it to the UI.
# Output Data Table ####
output$ads_table <- DT::renderDataTable({
# If the goButton hasn't been pressed,
# don't make a table.
if(input$goButton == 0){return()}
# We're just going to assign
# the data returned from the
# reactive function to a new variable.
# The main reason I do this, is because
# later it can be easier to troubleshoot.
data_rtn <- get_ad_data()
# Then simply pass the table
# to the datatable() function.
datatable(data_rtn)
})
}) # Close the opening shinyServer(function(input, output) {
Conclusion
That’s about it, however, you do need to call the app with:
shinyApp(ui = ui, server = server)

Now you have an app that will list the ads that need to be paused because, statistically, they are not as good as top performing ad in the given ad group. This is better than just eye-balling the ads to guess poor performers and it scales. With some additional programming, you can scale this to numerous accounts.
It would seem that automatically pausing those ads would be a good idea. However, I’m not sure about that. I think you want to study the good and bad performers and figure out why some ads are performing better than others. Then pause the poor performing ads and introduce new ones based on what you learned.
You can find the full code to this app on my GitHub @ https://github.com/daranjjohnson/underperforming_google_ads.
Sample App
To see a working example of the app, click here. This sample app is hosted on shinyapp.io and changing the dates does not change the data. However, which ads need updating change based on whether you select “Conversion Rate” or “CTR” as to how you want to evaluate the ad performance.
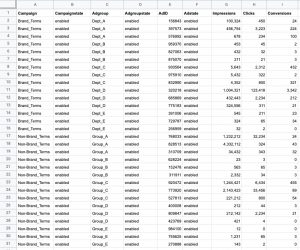
Here is the data used in the app:

When you identify poor performing google ads, You’ll notice that some of the ad groups do not show up in the list. Ads, such as Dept_B under Brand_terms, for both calculations by CTR and Conversion Rate. This is because Dept_B numbers between ads are too close to call. For some ads it will also be because the the number of impressions is too low to determine whether they are underperforming or not.

